What Are the Best Energy Sources for Global Buyers in 2026?
Global energy buyers enter 2026 with more choices, but also more uncertainty. Solar panels, wind farms, natural gas, nuclear power, batteries, and renewable fuels compete for investment. Each option carries different costs, risks, and delivery timelines. The best decision depends on geography, grid strength, industrial demand, and long-term purchasing goals.
Fatih Birol, Executive Director of the International Energy Agency, has said, “Energy is the golden thread that connects economic growth, increased social equity, and an environment that allows the world to thrive.” His observation remains relevant for every source and energy procurement strategy. A factory in Southeast Asia may value dependable gas and storage. A European manufacturer may prioritize renewable electricity and verified emissions data. A remote mining operation may need solar, batteries, and backup generation beside its haul roads.
Price still matters. Reliability matters more than many buyers admit. A low-cost contract can become expensive when transmission delays, fuel volatility, or weak storage disrupt production. Clean energy can also create hidden pressure, including land use, mineral supply, and recycling challenges. There is no perfect answer.
Not yet.
This guide compares energy sources through practical measures: cost stability, carbon performance, scalability, resilience, and infrastructure readiness. It uses industry evidence and current market perspectives, while recognizing that forecasts can change quickly. Buyers should question attractive promises, check supplier records, and match each decision with measurable operational needs. A thoughtful portfolio may outperform a single fashionable solution in 2026.
Defining the Key Criteria for Choosing Energy Sources in 2026
Global buyers in 2026 need more than a low headline price when choosing energy sources. They should assess reliability, lifecycle emissions, supply security, and long-term affordability together. A cheaper source may require costly backup, grid upgrades, or imported equipment. Those hidden expenses can change the procurement decision.
A practical review begins with hourly demand data, not annual averages. A factory may need stable power during a winter evening when renewable output falls. Buyers should examine storage capacity, backup arrangements, transmission access, and maintenance response times.
They should also check how emissions are measured, including extraction, transport, construction, and disposal. Certifications and independent audits can make supplier claims easier to verify.
Local conditions matter greatly. Water availability, land pressure, extreme weather, and permitting timelines can affect project performance. Contract terms deserve equal attention, especially price adjustment clauses and delivery guarantees.
Forecasts can fail. Even carefully modeled projects face delays, equipment shortages, or sudden policy changes. A weighted scorecard helps compare these risks, but it is not perfect. Buyers should revisit the model when demand changes, rather than treating one approval as permanent. Clear records, tested assumptions, and transparent reporting provide stronger evidence than impressive promises.
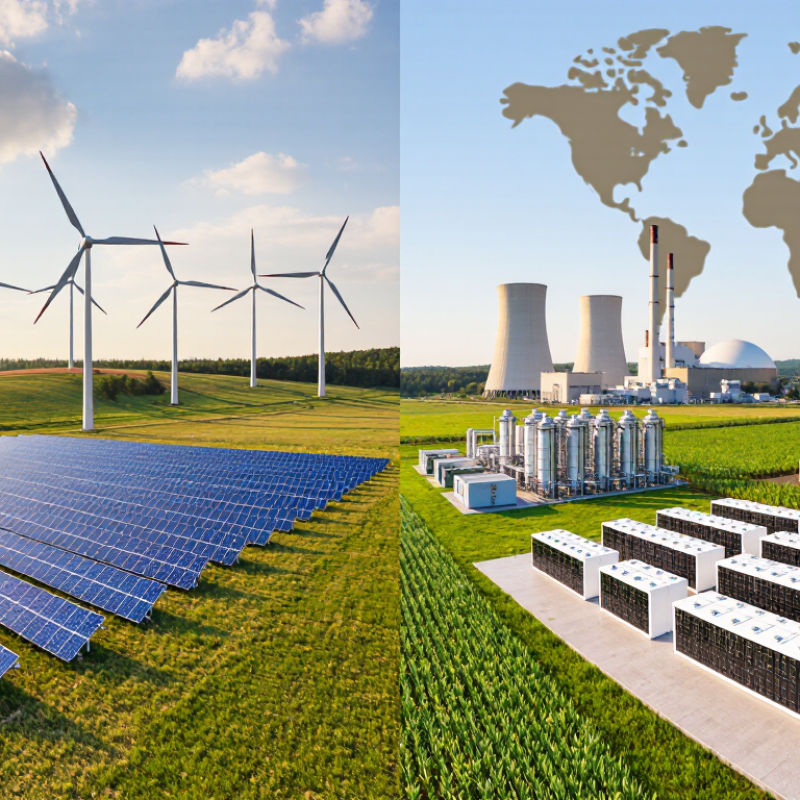
Comparing Renewable and Conventional Energy Options
What Are the Best Energy Sources for Global Buyers in 2026?
Comparing Renewable and Conventional Energy Options
Global buyers in 2026 are comparing more than electricity prices. They are weighing carbon exposure, reliability, delivery speed, and grid access. IRENA’s Renewable Capacity Statistics 2025 reports that renewables added 585 gigawatts worldwide in 2024. They represented 92.5% of new power capacity. Solar and wind now offer competitive daytime and seasonal supply, especially where land and transmission are available.
Yet renewable power is not automatically firm power. Buyers may need batteries, demand management, or flexible generation during calm evenings. The IEA’s Renewables 2024 report expects renewables to provide nearly 95% of global electricity-demand growth through 2027. That growth is impressive. Storage remains uneven. Conventional sources, including gas, coal, and nuclear power, can provide steadier output, but their fuel, emissions, and regulatory risks differ sharply. The Energy Institute’s Statistical Review 2025 recorded another rise in global energy demand during 2024, while fossil fuel consumption also reached a new high.
A practical portfolio may combine solar or wind contracts with storage and limited firm capacity. Buyers should examine hourly production, curtailment, transmission queues, and backup costs rather than headline tariffs. The IEA estimated global clean-energy investment would reach about $2 trillion in 2024, twice fossil-fuel investment. That signals momentum, not certainty. Costs still mislead. A renewable project can be cheap at the plant gate but expensive after balancing and network upgrades. Conventional power can appear dependable while exposing buyers to fuel-price volatility and future carbon costs. No option is flawless.
What Are the Best Energy Sources for Global Buyers in 2026? - Comparing Renewable and Conventional Energy Options
Indicative global comparison of major electricity-generation options for procurement, investment and long-term energy planning.
| Energy source |
Typical new-build LCOE
(USD/MWh) |
Typical capacity factor |
Lifecycle emissions
(gCO₂e/kWh) |
Dispatchability |
Typical project lead time |
Fuel-price exposure |
Water requirement |
Best fit for global buyers |
| Utility-scale solar photovoltaic |
25–75 |
15–30% |
20–50 |
Variable; forecastable with storage |
6–24 months |
Very low |
Low during operation |
Low-cost daytime supply, distributed generation and rapid capacity additions |
| Onshore wind |
25–75 |
30–50% |
7–16 |
Variable; forecastable with storage |
1–3 years |
Very low |
Low during operation |
Low-cost bulk electricity in windy regions with available land and grid access |
| Offshore wind |
60–140 |
40–60% |
8–20 |
Variable; forecastable with storage |
3–7 years |
Very low |
Low during operation |
High-volume coastal power where land is limited and wind resources are strong |
| Hydropower |
40–120 |
30–60% |
1–30 |
Dispatchable; storage reservoirs can provide flexibility |
5–10+ years |
Very low |
Medium to high site dependence |
Long-life firm power, grid balancing and seasonal storage where suitable sites exist |
| Geothermal |
60–110 |
70–95% |
15–55 |
Generally dispatchable |
2–5 years |
Very low |
Medium; depends on cooling technology |
Reliable low-carbon baseload in areas with suitable geothermal resources |
| Nuclear power |
120–220 |
80–95% |
5–20 |
Dispatchable; generally suited to steady output |
7–15+ years |
Low to medium |
High for conventional cooling systems |
Firm low-carbon electricity for systems that can support long development cycles and strict regulation |
| Natural gas power |
45–120 |
25–70% |
380– more than 1,000 |
Highly dispatchable and flexible |
2–4 years |
High |
Low to medium |
Fast-response capacity, balancing variable renewables and markets with dependable fuel supply |
| Coal power |
65–170 |
40–75% |
820–1,050 |
Dispatchable but relatively inflexible |
3–6 years |
High |
High for wet-cooled plants |
Existing-fleet reliability in some markets, but exposed to carbon, air-pollution and policy risks |
| Biomass power |
75–160 |
50–85% |
100–400 |
Dispatchable, subject to feedstock availability |
2–5 years |
Medium to high |
Medium |
Firm power using sustainable local residues, waste streams or certified feedstocks |
Interpretation notes:
The figures are indicative global ranges for new electricity projects and can vary substantially by country, resource quality, financing cost, grid connection, construction conditions, fuel prices and regulation. Levelized cost of electricity excludes transmission, distribution, balancing and most system-integration costs. Lifecycle-emission values include construction, fuel supply and operation over the full project life; gas values can increase materially when methane leakage is high. A balanced 2026 procurement strategy commonly combines low-cost variable renewables with storage, transmission, demand flexibility and a smaller amount of firm generation.
Reference basis: Ranges are consistent with widely reported assessments from the International Energy Agency, the International Renewable Energy Agency, the Intergovernmental Panel on Climate Change and the U.S. National Renewable Energy Laboratory.
Examining Regional Energy Needs and Market Conditions
What Are the Best Energy Sources for Global Buyers in 2026?
The best energy source depends on regional demand, infrastructure, and price stability. Buyers in sunny regions may favor solar power, especially where daytime cooling creates heavy electricity loads. Wind energy can suit coastal plains and open inland areas with steady air movement. However, generation alone is not enough. Grid capacity, storage, and maintenance skills often decide whether a project performs well.
Industrial buyers may still need natural gas for flexible supply during peak demand, although price swings and emissions rules require careful planning. Hydropower remains valuable in areas with reliable rainfall, but drought can reduce output sharply. In colder regions, nuclear energy may provide stable baseload electricity, yet construction timelines and financing risks can be difficult. Market conditions change quickly. A source that looks cheapest today may become expensive after grid upgrades, fuel changes, or new regional policies.
Tips: Compare five-year costs, not only purchase prices. Check local weather records and transmission limits. Ask suppliers for verified performance data and maintenance plans. Independent engineering reviews can reveal hidden weaknesses. I have seen forecasts overestimate renewable output when seasonal patterns were ignored. Buyers should leave room for uncertainty, because no energy mix works equally well everywhere. Small pilot projects can test real conditions before larger commitments.
What Are the Best Energy Sources for Global Buyers in 2026?
Regional electricity demand is expected to grow fastest in India, China, and Southeast Asia through 2026, while mature markets show slower expansion. Buyers may therefore prioritize scalable, lower-carbon sources such as solar, wind, hydropower, and nuclear, supported by flexible gas and storage where grid reliability is critical.
Average annual electricity demand growth forecast for 2024–2026. Values are rounded from International Energy Agency, Electricity 2024.