

10 Best Clean Energy Solutions for Global Buyers
Global buyers are rethinking energy procurement as fuel prices, grid pressures, and climate targets reshape business decisions. Clean energy is no longer limited to solar panels on factory roofs. It includes wind power, battery storage, green hydrogen, geothermal systems, renewable heat, and smarter energy management. Each solution carries different costs, performance limits, and infrastructure requirements.
This guide examines ten practical clean energy solutions for international buyers. It considers installation conditions, energy output, maintenance needs, financing models, supplier reliability, and long-term scalability. A solar project may suit a warehouse in Spain, yet perform poorly without storage in a cloudy region. A battery system can stabilize operations, but its replacement cycle deserves careful review. Green hydrogen offers industrial potential, although transport and certification remain challenging. These details matter during tender evaluations.
Reliable purchasing requires more than comparing headline prices. Buyers should examine warranties, project references, safety records, lifecycle emissions, and local service capacity. They should also request transparent data on energy yields and degradation rates. Numbers can look impressive.
However, no solution works equally well everywhere. Grid connection delays, changing regulations, land availability, and currency risks can alter a project’s value. Some technologies remain expensive or commercially immature. That should be acknowledged, not hidden. A careful buyer may combine several options, such as rooftop solar, battery storage, and verified renewable power contracts. The strongest choice is usually the one that fits actual operating conditions, not the one with the most fashionable label.
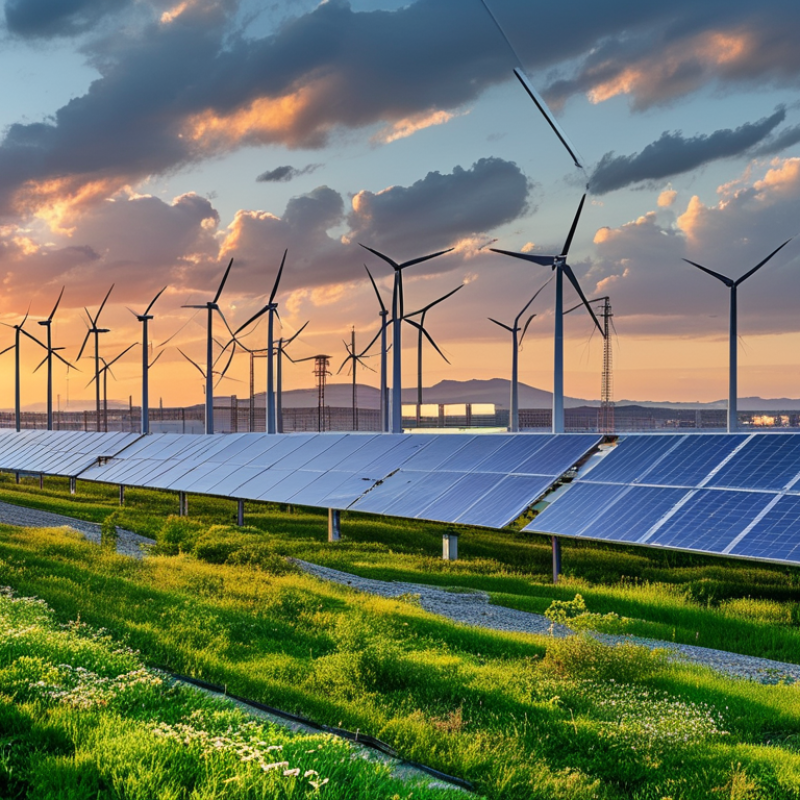
Clean Energy Solutions Ranked by IEA’s 2023 Global Deployment Data
The IEA’s 2023 global deployment data places solar photovoltaic systems at the top. They delivered the largest share of new renewable capacity, supported by falling costs and quick installation. Onshore wind follows, especially where open land and reliable grid access are available. Hydropower remains a major asset, although new projects often require long planning periods and careful environmental assessment. Offshore wind ranks fourth, with strong potential near coastal demand centers but higher construction risks.
Bioenergy ranks fifth, using agricultural residues, organic waste, and sustainable forestry materials. Heat pumps deserve sixth place because they reduce fossil fuel use in buildings, even though their deployment is measured differently from power capacity. Geothermal energy ranks seventh, offering steady output where suitable underground resources exist. Concentrated solar power takes eighth place, with thermal storage helping supply electricity after sunset. Renewable hydrogen ranks ninth, but its commercial deployment remains uneven. Small-scale solar systems complete the tenth position, serving remote homes, farms, and small businesses.
This ranking reflects deployment momentum, not universal suitability. IEA data is authoritative, but global figures can hide local problems. A solar project may look excellent on paper, yet weak grid connections can delay revenue. Wind turbines need accurate resource studies. Heat pumps perform poorly in buildings with weak insulation. The ranking is imperfect. I may also overvalue capacity and undervalue maintenance experience, workforce skills, and recycling plans. Buyers should examine project conditions, operating records, financing assumptions, and measurable emissions data before choosing a solution.
10 Best Clean Energy Solutions for Global Buyers - Clean Energy Solutions Ranked by IEA’s 2023 Global Deployment Data
Global deployment indicators for 2023, ranked by reported market scale
| Rank | Clean Energy Solution | 2023 Global Deployment Indicator | Primary Buyer Applications | Key Advantages | Data Source |
|---|---|---|---|---|---|
| 1 | Solar Photovoltaics | Approximately 420 GW of new global capacity | Utility-scale plants, commercial rooftops, residential systems and off-grid power | Fast installation, modular deployment, declining technology costs and broad geographic suitability | IEA, Renewables 2023 |
| 2 | Onshore and Offshore Wind | Approximately 115 GW of new global capacity | Grid-scale electricity, industrial power procurement and renewable energy portfolios | High output at suitable sites, large project scale and strong complementarity with solar generation | IEA, Renewables 2023 |
| 3 | Electric Vehicles | Nearly 14 million electric cars sold globally | Passenger transport, commercial fleets, urban mobility and logistics | Lower operational emissions, reduced fuel dependence and improving total cost of ownership | IEA, Global EV Outlook 2024 |
| 4 | Battery Energy Storage | Approximately 42 GW of new battery storage capacity | Renewable integration, peak shaving, frequency regulation and backup power | Rapid response, flexible installation and improved grid reliability | IEA, Batteries and Secure Energy Transitions |
| 5 | Public Electric-Vehicle Charging | More than 4 million public charging points worldwide | Urban charging, highway corridors, workplaces, retail locations and fleet depots | Supports vehicle electrification, improves convenience and enables fleet transition | IEA, Global EV Outlook 2024 |
| 6 | Hydropower | Approximately 20 GW of new global capacity | Baseload electricity, flexible generation, water infrastructure and grid balancing | Dispatchable renewable power, long asset life and potential storage capability | IEA, Renewables 2023 |
| 7 | Sustainable Bioenergy | Approximately 8 GW of new renewable power capacity | Industrial heat, combined heat and power, renewable fuels and waste-to-energy systems | Dispatchable output and potential use of agricultural, forestry and municipal residues | IEA, Renewables 2023 |
| 8 | Green Hydrogen Electrolysis | Approximately 1.4 GW of installed water-electrolysis capacity | Industrial feedstocks, refining, chemicals, heavy transport and seasonal energy storage | Enables renewable electricity to serve difficult-to-electrify applications | IEA, Global Hydrogen Review 2024 |
| 9 | Geothermal Energy | Approximately 0.2 GW of new global power capacity | Baseload electricity, district heating, industrial heat and direct-use applications | High capacity factor, low land footprint and weather-independent generation | IEA and IRENA renewable-capacity data for 2023 |
| 10 | Concentrated Solar Power | Approximately 0.3 GW of new global capacity | Dispatchable renewable electricity and thermal energy with storage capability | Thermal storage can extend renewable generation beyond daylight hours | IEA, Renewables 2023 |
Note: Deployment indicators use the measurement reported by the source, including new capacity, vehicle sales, installed equipment and infrastructure stock. Because the units differ, the ranking is intended as a market-scale guide rather than a direct comparison of physical output.
Related Posts
-
2026 Top Sources and Energy Trends Transforming the Future
-
Top 10 Clean Energy Innovations Transforming the Future?
-
How to Source Clean Energy Solutions for Global Procurement?
-
What is Energy Solutions and How They Impact Global Sustainability Efforts
-
China Top Clean Energy Innovations Transforming the Global Market?
-
What is Alternative Energy and How Does it Impact Our Future?